Scientists map Earth’s seafloor in detail and discover nearly 100,000 submerged mountains
-
There are better maps of the lunar surface than of Earth’s ocean floor, but this is changing thanks to high-resolution data obtained from space by satellites.
Researchers have been working for decades to change this situation. As part of this ongoing effort, a NASA-funded team recently published one of the most detailed maps of the ocean floor to date, using data from the SWOT (Surface Water and Ocean Topography) satellite.
Detailed seafloor maps: generation and uses
Accurate maps of the ocean floor are crucial for various maritime activities, such as navigation and the laying of submarine communication cables. They are also important for better understanding deep-sea currents and tides, which affect life in the depths, as well as geological processes such as plate tectonics. Underwater mountains, called seamounts, and other ocean floor features, like their smaller relatives, abyssal hills, influence the movement of heat and nutrients in the deep sea and can attract life.
Ships equipped with sonar can make direct and incredibly detailed measurements of the ocean floor. However, to date, only about 25% has been studied in this way. To obtain a comprehensive picture of the seafloor, researchers have relied on satellite data.
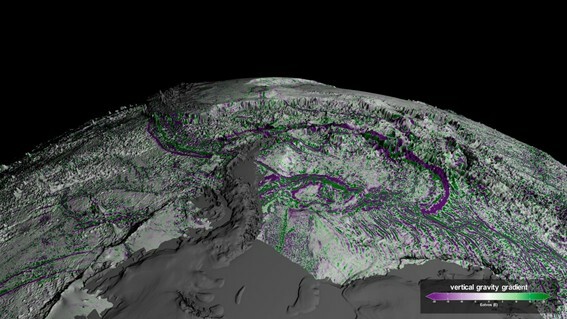
Because geological features like seamounts and abyssal hills have greater mass than their surroundings, they exert a slightly greater gravitational pull, creating tiny, measurable bumps on the sea surface. These subtle gravitational signals help researchers predict the type of seafloor formation that produced them.
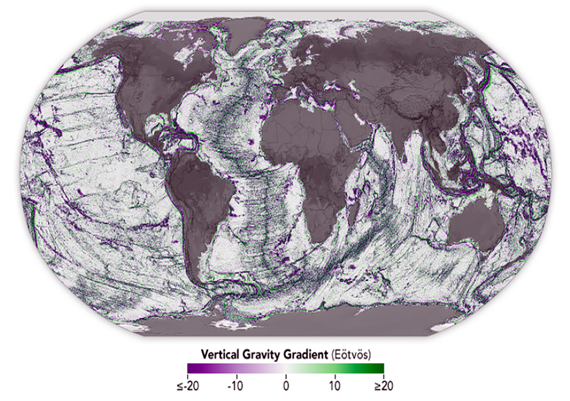
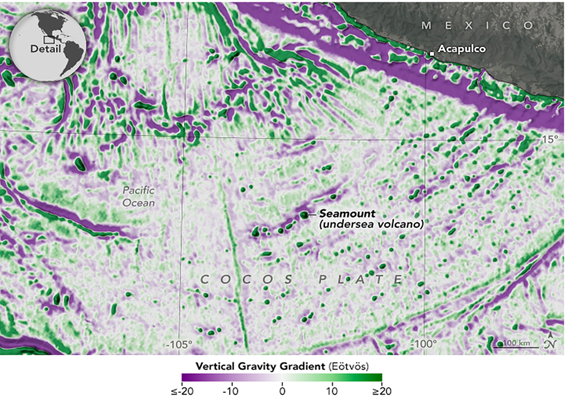
SWOT, a collaboration between NASA and the French space agency CNES (Centre National d’Etudes Spatiales), covers approximately 90% of the planet every 21 days. Through repeated observations, the satellite is sensitive enough to detect these tiny, centimeter-precise differences in sea surface height caused by underlying features. David Sandwell, a geophysicist at the Scripps Institution of Oceanography, and his colleagues used a year of SWOT data to focus on seamounts, abyssal hills, and submarine continental margins, where continental crust meets oceanic crust. The results of their mapping work are visible on the global map (above) and in the detailed views above and below. Areas of reduced gravity (purple) correspond to depressions in the seafloor, while areas of increased gravity (green) indicate the location of more massive elevated structures.
Previous ocean-observing satellites have detected massive versions of these seafloor features, such as seamounts more than a kilometer high. The SWOT satellite can detect seamounts less than half that height, potentially increasing the number of known seamounts from 44,000 to 100,000. These seamounts jut into the water, influencing deep ocean currents. This can concentrate nutrients on their slopes, attracting organisms and creating oases in what would otherwise be barren areas of the seafloor.
“The SWOT satellite represented a major advance in our ability to map the seafloor,” Sandwell said. Sandwell has used satellite data to map the ocean floor since the 1990s and was one of the researchers responsible for the SWOT-based seafloor map, published in the journal Science in December 2024.
SWOT’s improved view also provides researchers with more information about the planet’s geological history.
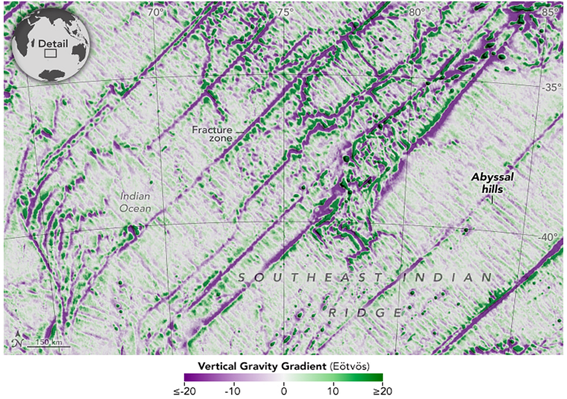
“Abyssal hills are the most abundant landform on Earth, covering approximately 70% of the ocean floor,” said Yao Yu, an oceanographer at the Scripps Institution of Oceanography and lead author of the paper. “These hills are only a few kilometers wide, making them difficult to observe from space. We were surprised that SWOT was able to observe them so well.”
Abyssal hills form in parallel bands, like washboard ridges, where tectonic plates are moving apart. The orientation and extent of the bands can reveal how tectonic plates have moved over time. Abyssal hills also interact with tides and deep ocean currents in ways that researchers do not yet fully understand.